SaaS Retention & Churn Analysis - Business Report
![]()
Business Problem
Software as a service (SaaS) businesses depend on recurring revenue and long-term subscriber engagement.
A key challenge is customer churn, especially in the first few months of a subscription.
This analytics report explores churn dynamics through cohort analysis, retention tracking, and predictive modeling to:
- Identify high-risk customers
- Measure retention rates across cohorts and subscription tiers
- Recommend strategies for subscriber retention and business growth
Note: This is a synthetic case study built from public and generated data. The primary objective is to demonstrate my ability to design a structured analytics workflow, manage data in a relational database, and present actionable insights in a way that would be meaningful to business stakeholders.
Context:
Churn == missed opportunity for deeper customer lifetime value (LTV). By analyzing subscriber cohorts (defined by the first-time subscription month) and churn patterns, we can identify where retention investments yield the greatest impact.
Strategic levers include:
- Strengthening onboarding for new subscribers
- Creating loyalty and engagement campaigns
- Offering targeted discounts or perks to at-risk customers
- Upselling satisfied Standard users into Premium plans
Important Limitations:
- This is a synthetic study for portfolio purposes only. The data is a combination of Kagle dataset and synthetic data created by a random algorithm for invoices patterns and subscription tiers details, in order to simulate a relational database with pgAdmin (PostgreSQL).
- KPIs are based on simplified assumptions (e.g., churn = binary, no reactivations).
- Cohort granularity is monthly; in real settings, weekly or daily cuts may reveal sharper insights.
Subscription types are artificially balanced; in reality, Premium users are usually a minority segment.
Approach
Data Source
The data used is a combination of SaaS subscription dataset sourced from Kaggle, enriched by two additional synthetic datasetes to mimic a real SaaS environment. Rather than working solely with CSV files, I designed a PostgreSQL database in pgAdmin to simulate an operational data store.
- Schema design: Defined customers, subscriptions, and invoices tables with primary keys and relationships, reflecting common SaaS data models.
- Data Integrity: Enforced typing and column normalization (e.g., lower snake_case naming convention) to align with production-ready best practices.
- Storage & monitoring: Using pgAdmin allowed me to write raw SQL queries, validate cohorts directly in SQL, and monitor data health before pulling into Python for analysis.
This setup was done with a purpos to enforce end-to-end ownership: from raw data ingestion to structured relational storage, ensuring queries scale and analysis is reproducible. 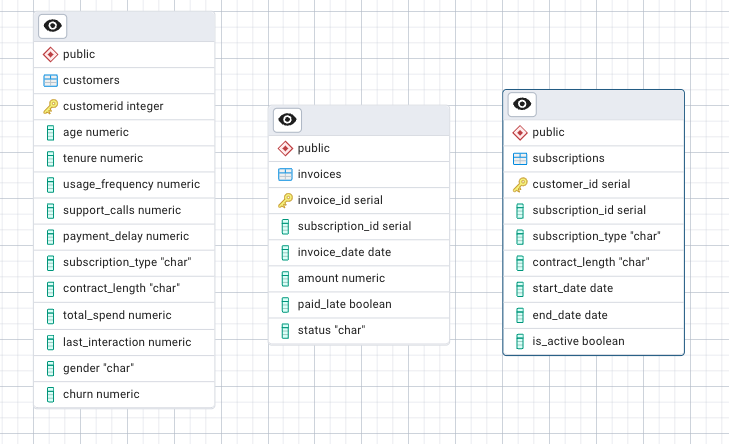
Defined KPIs
To track the effectiveness of retention strategies, I defined and monitored the following key SaaS metrics that can be directly translated to real-world stakeholder reporting:
- Monthly Retention Rate = % of active users retained since signup
- Churn Rate = % of users lost each period
Data Pipeline
The project pipeline was intentionally modular to reflect real-world data workflows:
- Ingest data into pgAdmin database
data/. - Process with SQL queries for cohort-based retention metrics, ensuring transparency and reusability
sql/. - Analyze & Vizualize Pulled SQL results into Jupyter Notebooks using Python for deeper aggregation, exploratory analysis, and business-ready visualization.
notebooks/. - Predictive Modeling: Trained an ensemble Random Forest churn prediction model to proactively flag at-risk subscribers with 98% recall score (recall was chosen as the key metric as falsely mislabelling a churned customer as non-churn carries higher risks for the business).
src/. - Monitoring: Pipeline montoring with evidently package to check for any feature distribution drifts, and other data anomalies as new data is ingested on a defined cadence.
src/monitor.py
Run the whole pipeline with ./run_pipeline.py
Results
Average Retention Trend
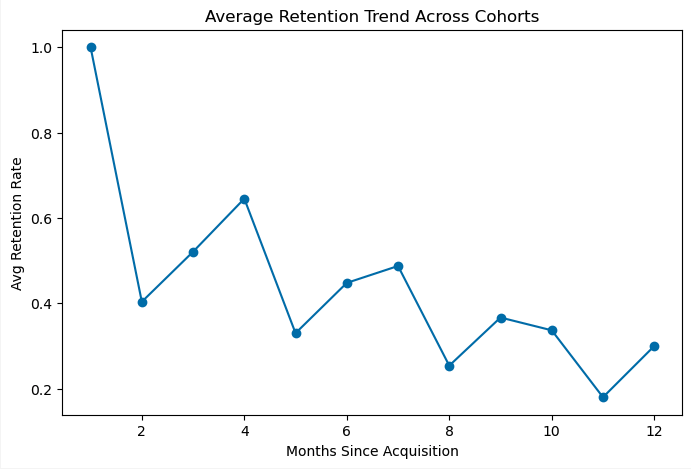
Retention declines steeply in the first few months for each cohort, indicating that early churn is the biggest risk area. Cohorts follow a consistent downward trend: the largest drop occurs after the first month, stabilizing later. Because the data is synthetic, seasonal or external demand effects are not captured. In a real-world dataset I would opt in to visualize cohort month by month retention trends via a heatmap to zoom in on any hidden seasonal trend analytics.
Retention Curves by Subscription Type
Basic
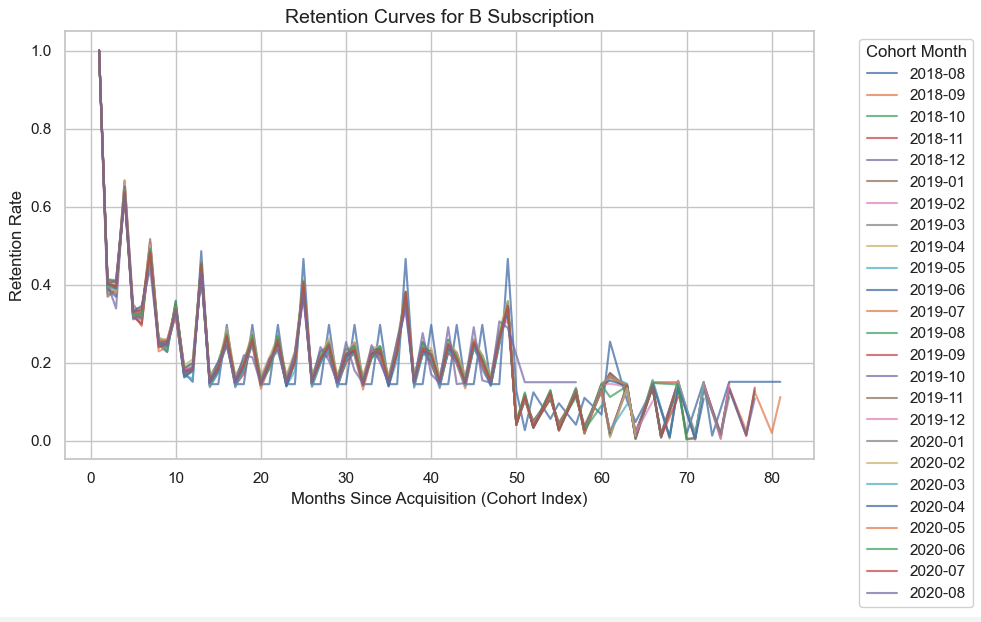
We can observe similar trend as per cohort general analytics. However, since the dataset is synthetic, curves across subscription tiers look very similar if not identical. In real-world data, Basic plans typically show the sharpest early churn, while Premium customers retain longer.
Churn Distribution by Support Calls
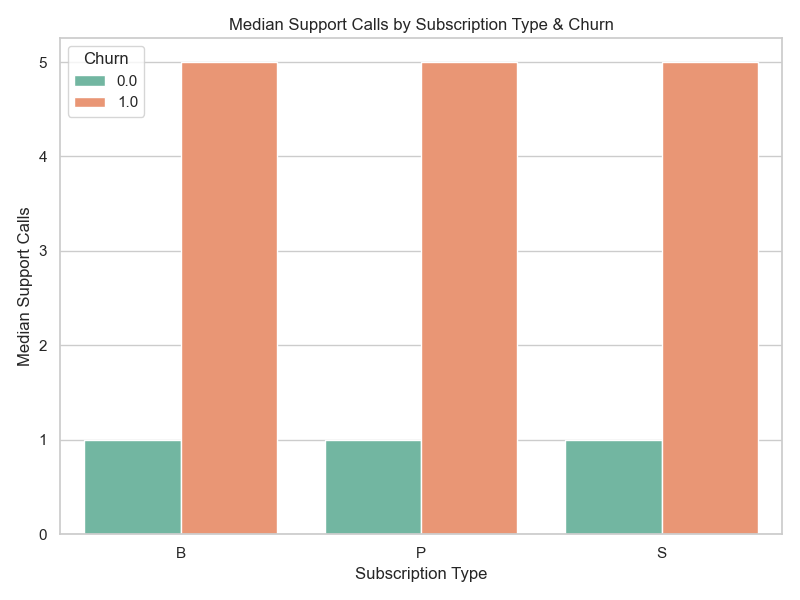
Customers who churn make more support calls, suggesting friction or dissatisfaction is a churn driver. Median was plotted as the distribution of support calls feature is skewed.
However, subscription type alone does not explain churn risk — behavioral signals like usage and support tickets could provide better insights into the state of the customer support operations.
Insights & Recommendations
- Critical Period: Retention curves show the first 1–3 months are the riskiest for churn. Focused onboarding, guided product tours, and early engagement campaigns (emails, in-app nudges) should be prioritized.
- Tier Strategy: While synthetic data limited variability, industry benchmarks suggest Standard-tier users are prime candidates for upsell to Premium through added features or loyalty discounts.
- Customer Support Friction: Strong correlation between high support call volume and churn suggests dissatisfaction is a major driver. Review support operations — especially ticket resolution times, escalation workflows, and self-service resources.
- Predictive Targeting: The Random Forest churn model identifies at-risk users before they churn, enabling proactive retention campaigns. Continuous drift monitoring should be applied to keep predictions aligned with evolving user behavior.
- Data Infrastructure: Cohort analysis in PostgreSQL provides scalable retention tracking, while visualization in Python ensures business teams can monitor KPIs intuitively. This pipeline demonstrates a repeatable process for ongoing subscriber health monitoring
Next Steps
- A/B test different onboarding flows for new subscribers
- Introduce loyalty rewards for long-term retention
- Monitor churn predictions monthly and refine the model
- Expand segmentation by demographics or product usage for deeper insights
Resources
Tech Stack: PostgreSQL, pgAdmin, scikit-learn, evidently, matplotlib, seaborn, quarto